UI/UX Product Design
Tools Campaign
Overview
Vanguard’s internal sales team and relationship managers required a more sophisticated approach to discuss investment strategies with clients. The objective was to create a web application that allows users to build and analyze custom investment portfolios effectively. The tool aimed to simplify complex financial data, enabling clear and impactful conversations about investment decisions.

Problem Statment
The previous methods used by the sales team lacked the flexibility and sophistication needed to illustrate Vanguard's investment strategies effectively. Sales representatives struggled to convey the potential impact of investment changes to their clients, leading to missed opportunities and misunderstandings around investment policies.
Goals
Develop a user-friendly web application for building custom investment portfolios.
Enable users to conduct historical and future analysis of portfolios.
Present complex financial data in an engaging and understandable manner.
Support sales teams in articulating Vanguard's investment strategies more effectively.
Research
Our UX team conducted extensive research, including:
User Interviews
Conversations with sales team members and relationship managers to understand their workflows, challenges, and needs.
Stakeholder Meetings
Collaborations with business specialists to gather requirements and goals for the tool.
Competitive Analysis
Reviewing existing portfolio-building tools in the market to identify best practices and innovative features.
Design Process
User Personas
We created user personas representing different members of the sales team to guide our design decisions. These personas focused on their varying levels of financial knowledge and technological proficiency.
Wireframes & Prototyping
Initial wireframes were developed to map out the user journey. The design emphasized:
User-Centric Navigation
Ensuring easy access to key functionalities like portfolio creation and analysis.
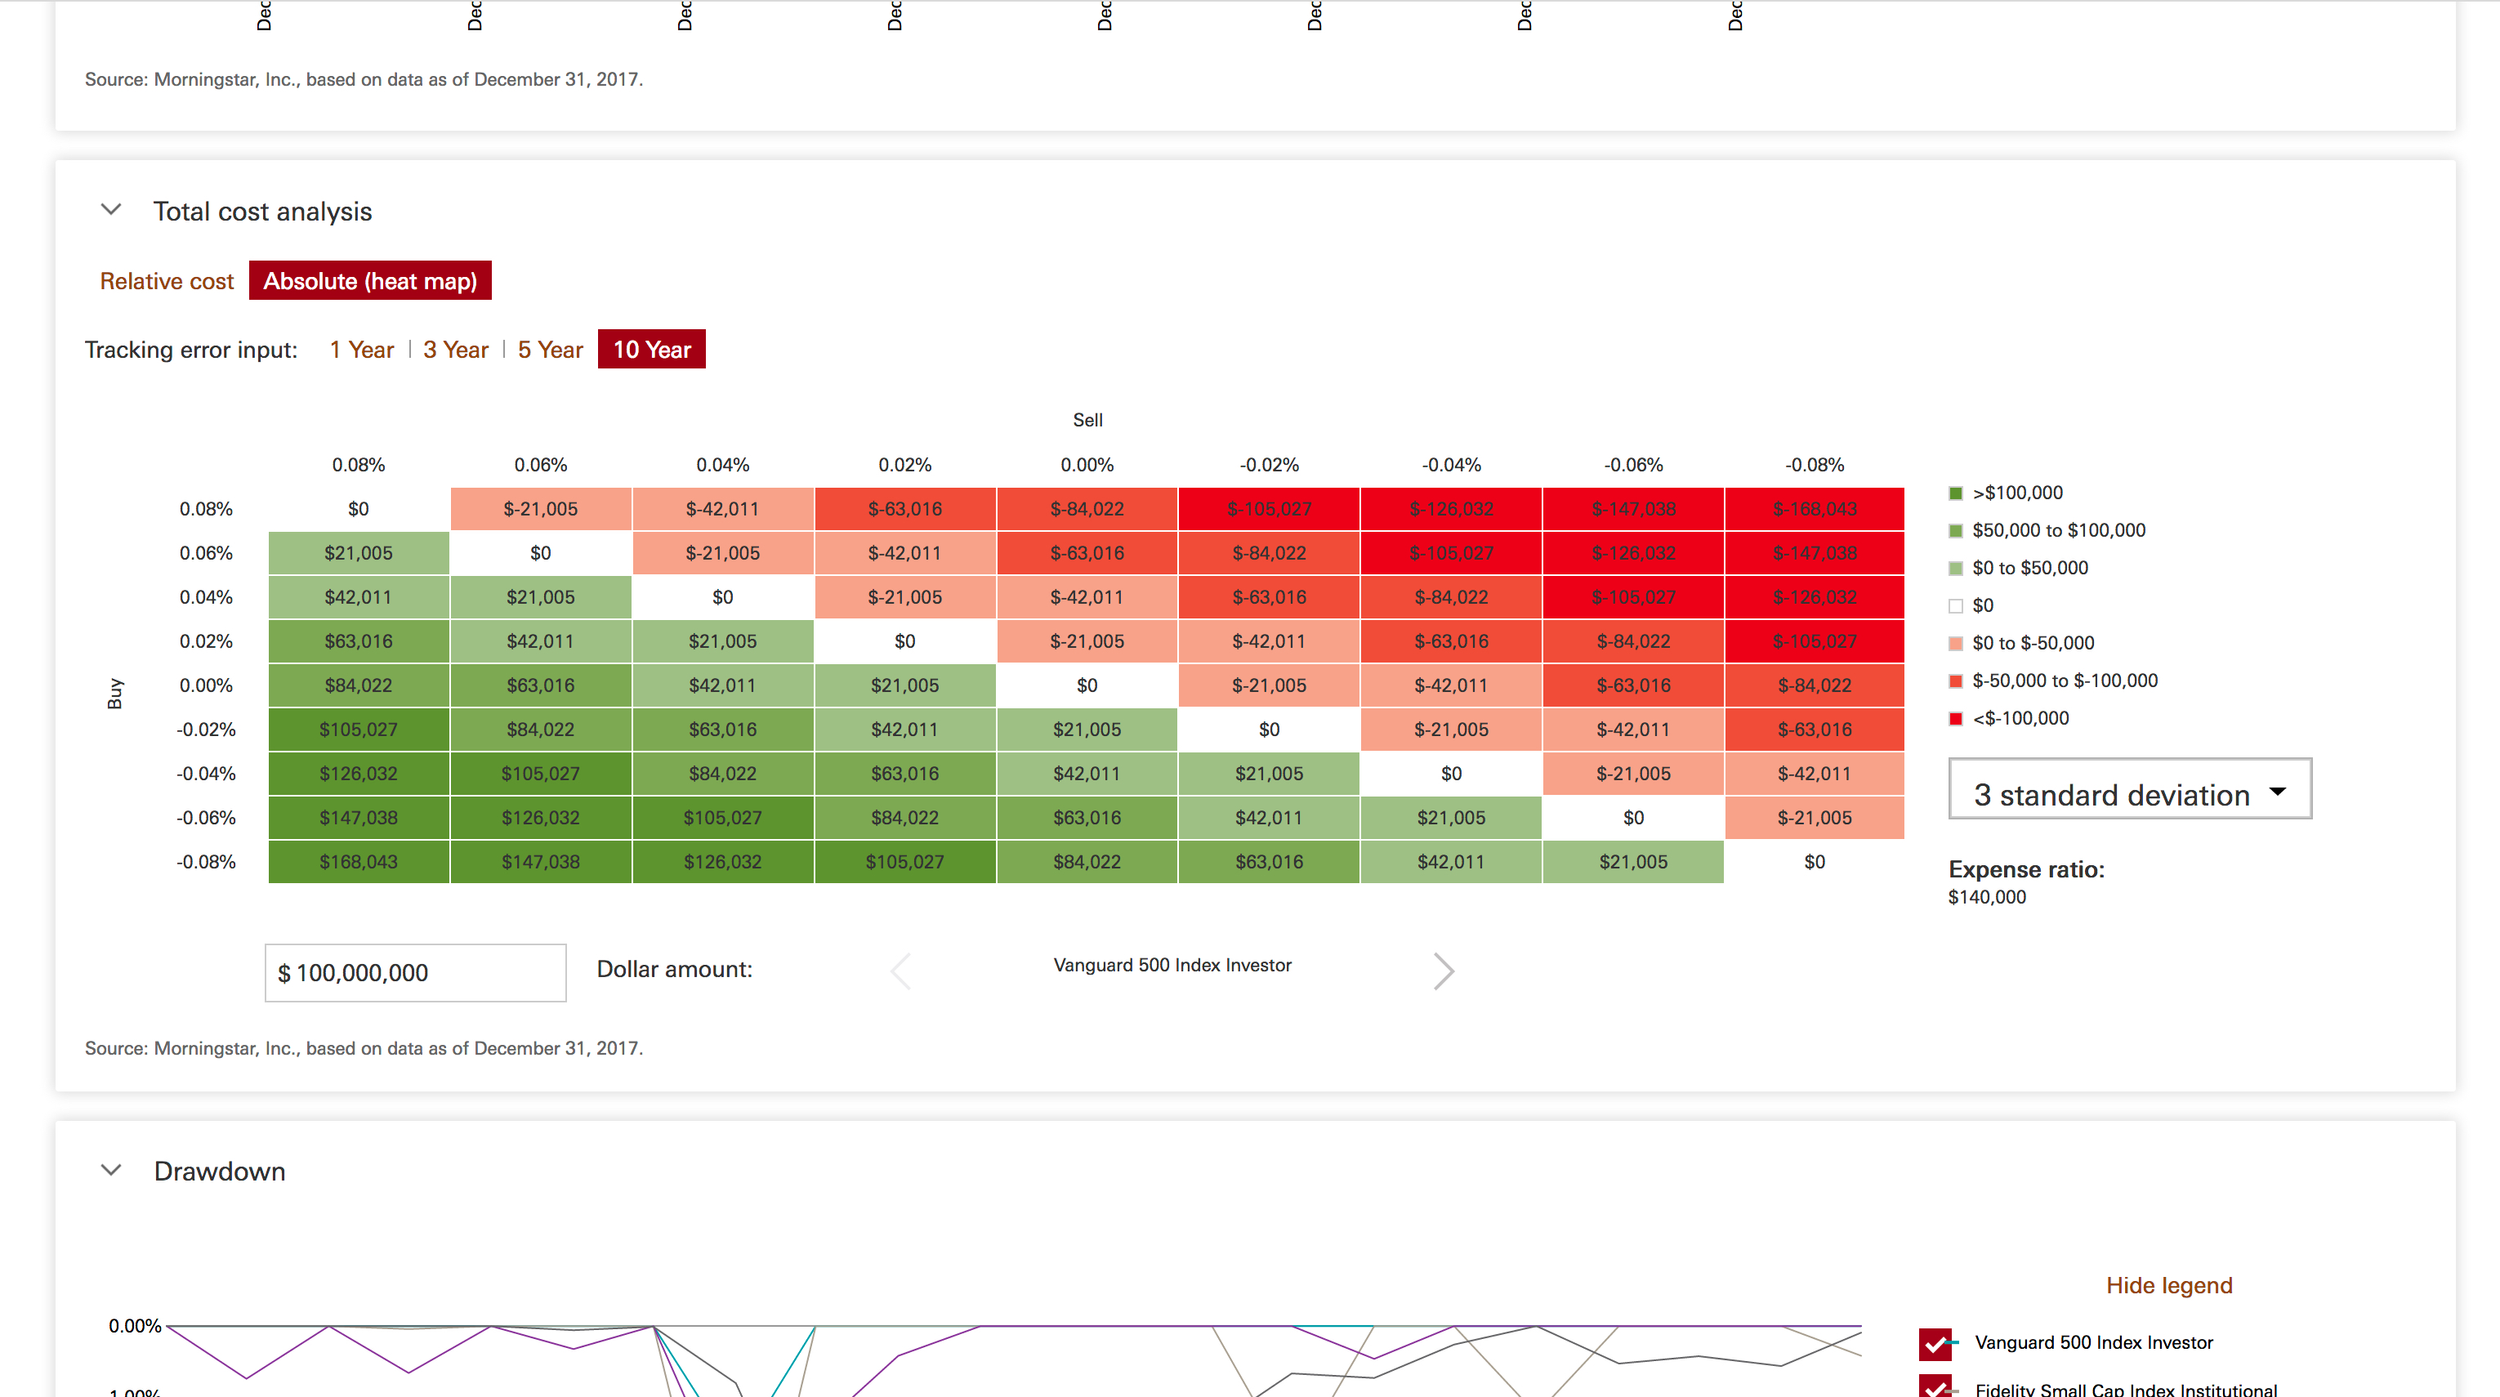
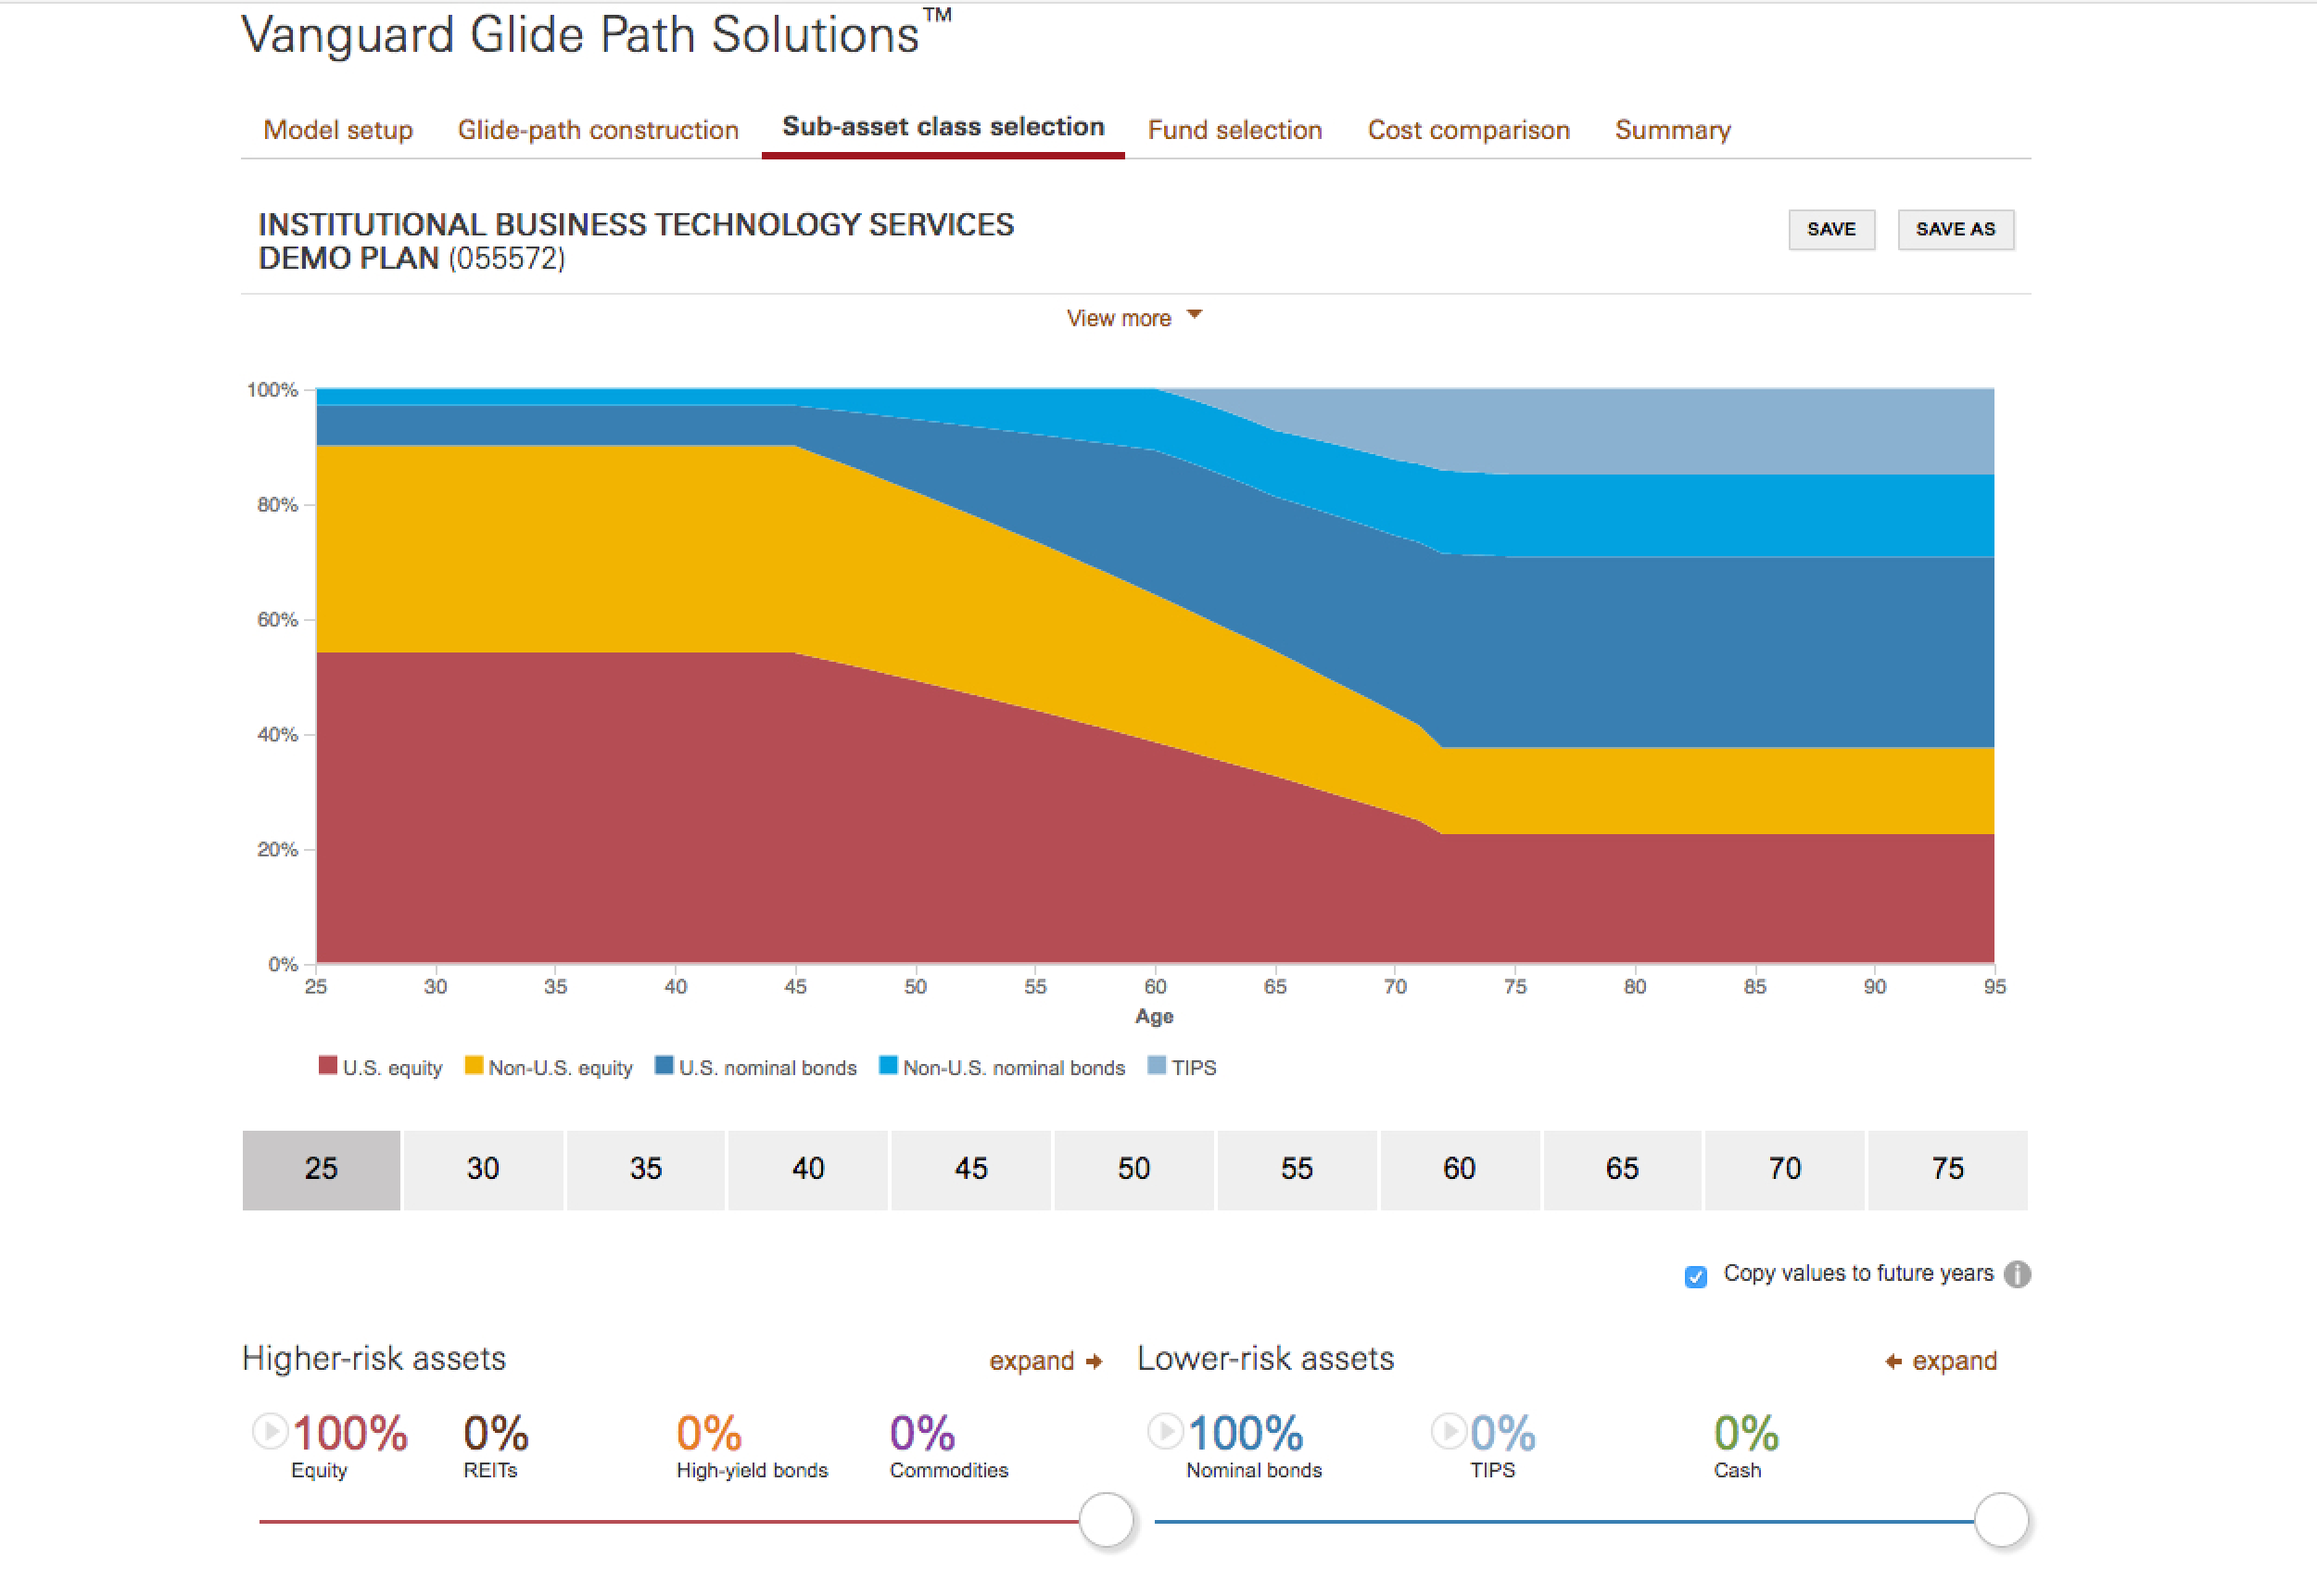
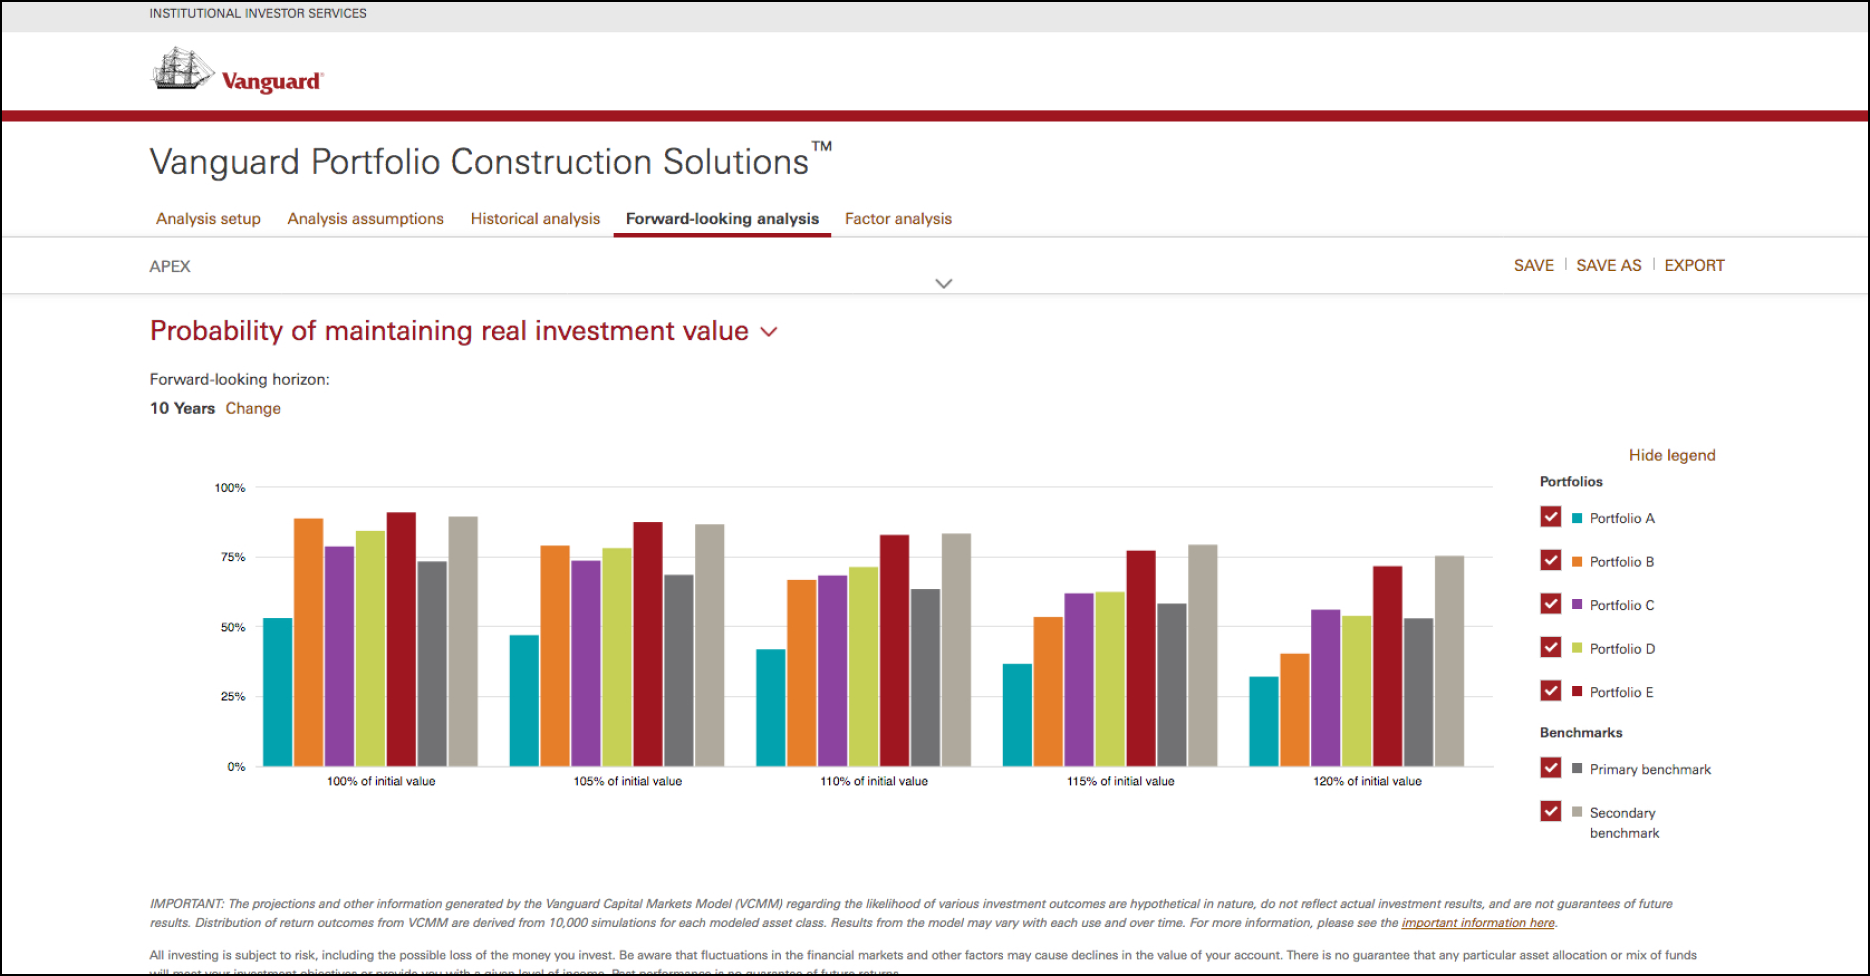
Visual Data Representation
Utilizing charts, graphs, and sliders to allow users to manipulate investment parameters seamlessly.
User Testing
After developing a prototype, we conducted user testing sessions with select sales team members. Observing users interact with the tool in a simulated client meeting context provided invaluable insights. We iterated on the design based on feedback, enhancing usability and ensuring the tool met real-world needs.
Visual Design and Information Hierarchy
With two junior UX designers, we established a design system to ensure consistency across the tool set. This included:
Color Schemes & Typography
A professional yet engaging aesthetic to reflect Vanguard’s brand.
Information Hierarchy
Designing clear pathways and emphasis where users needed it most, facilitating efficient interaction with complex data.
Implementation
Collaboration with the development team was crucial to ensure the accurate and timely delivery of the tool. Regular check-ins and alignment meetings helped us address technical constraints while maintaining design integrity.
Outcome
The final product was a resounding success, empowering the sales team to:
Create customized client portfolio models to illustrate the implications of changes in investment strategies.
Present robust analyses that enhance conversations with potential clients, thereby increasing engagement and conversion rates.
Adapt to market changes quickly, with tools that are continuously updated and improved based on user feedback and financial data.
Conclusion
The custom investment portfolio tool transformed how Vanguard’s internal sales team communicates investment strategies. It not only provided them with a practical solution but also established a framework for ongoing enhancements. The collaborative cross-functional approach, guided by user-centered design principles, was pivotal in achieving a successful outcome.
This project underscores the importance of understanding user needs, iterating based on feedback, and ensuring design consistency across different functionalities. The experience gained here will guide future projects in leveraging design to solve complex business problems effectively.
Key Metrics
User Engagement
Post-launch analytics showed a 30% increase in the time users spent analyzing plan data compared to the prior tool.
Task Success Rate
Usability testing indicated an 85% success rate for users completing core tasks (e.g., generating comparisons and reports).
User Satisfaction
Surveys indicated an overall satisfaction score of 4.7 out of 5 based on ease of use and the helpfulness of insights provided by the tool.
Device Responsiveness
Testing across devices confirmed a 95% satisfaction rate for performance and usability on desktops, tablets, and mobile devices.
Outcomes
The Vanguard Retirement Plan Comparison Tool successfully launched, receiving positive feedback from users who reported enhanced confidence in making retirement plan decisions. The tool's interactive capabilities, combined with historical data analysis, equipped users with valuable insights that were previously cumbersome to obtain.
Future enhancements based on user feedback are being planned, including additional features for personalized recommendations and deeper analytical capabilities.
Conclusion
The project not only improved user engagement and satisfaction but also reinforced Vanguard's position as a leader in retirement planning solutions. By combining strategic UX design with robust data visualization, we created a meaningful tool that genuinely supports users in navigating their retirement planning needs effectively.